
Challenge
Identifying and eliminating duplicates is a cornerstone of effective marketing efforts and customer resource management initiatives, and it is an increasingly important driver of cost-efficient compliance with regulatory initiatives such as KYC (Know Your Customer).
Once duplicate records are identified, you can remove them from your dataset, and better recognize key relationships among data records (such as customer records from a common household). You can also match records or values against reference data to ensure data accuracy and validity.
This Best Practice is targeted toward Informatica Data Quality (IDQ) users familiar with Informatica's matching approach. It has two high-level objectives:
- To identify the key performance variables that affect the design and execution of IDQ matching plans.
- To describe plan design and plan execution actions that will optimize plan performance and results.
To optimize your data matching operations in IDQ, you must be aware of the factors that are discussed below.
Description
All too often, an organization's datasets contain duplicate data in spite of numerous attempts to cleanse the data or prevent duplicates from occurring. In other scenarios, the datasets may lack common keys (such as customer numbers or product ID fields) that, if present, would allow clear ‘joins’ between the datasets and improve business knowledge.
Identifying and eliminating duplicates in datasets can serve several purposes. It enables the creation of a single view of customers; it can help control costs associated with mailing lists by preventing multiple pieces of mail from being sent to the same person or household; and it can assist marketing efforts by identifying households or individuals who are heavy users of a product or service.
Data can be enriched by matching across production data and reference data sources. Business intelligence operations can be improved by identifying links between two or more systems to provide a more complete picture of how customers interact with a business.
IDQ’s matching capabilities can help to resolve dataset duplications and deliver business results. However, a user’s ability to design and execute a matching plan that meets the key requirements of performance and match quality depends on understanding the best-practice approaches described in this document.
An integrated approach to data matching involves several steps that prepare the data for matching and improve the overall quality of the matches. The following table outlines the processes in each step.
Step |
Description |
Profiling |
Typically the first stage of the data quality process, profiling generates a picture of the data and indicates the data elements that can comprise effective group keys. It also highlights the data elements that require standardizing to improve match scores. |
Standardization |
Removes noise, excess punctuation, variant spellings, and other extraneous data elements. Standardization reduces the likelihood that match quality will be affected by data elements that are not relevant to match determination. |
Grouping |
A post-standardization function in which the groups' key fields identified in the profiling stage are used to segment data into logical groups that facilitate matching plan performance. |
Matching |
The process whereby the data values in the created groups are compared against one another and record matches are identified according to user-defined criteria. |
Consolidation |
The process whereby duplicate records are cleansed. It identifies the master record in a duplicate cluster and permits the creation of a new dataset or the elimination of subordinate records. Any child data associated with subordinate records is linked to the master record. |
The sections below identify the key factors that affect the performance (or speed) of a matching plan and the quality of the matches identified. They also outline the best practices that ensure that each matching plan is implemented with the highest probability of success. (This document does not make any recommendations on profiling, standardization or consolidation strategies. Its focus is grouping and matching.)
The following table identifies the key variables that affect matching plan performance and the quality of matches identified.
Factor |
Impact |
Impact summary |
Group size |
Plan performance |
The number and size of groups have a significant impact on plan execution speed. |
Group keys |
Quality of matches |
The proper selection of group keys ensures that the maximum number of possible matches are identified in the plan. |
Hardware resources |
Plan performance |
Processors, disk performance, and memory require consideration. |
Size of dataset(s) |
Plan performance |
This is not a high-priority issue. However, it should be considered when designing the plan. |
Informatica Data Quality components |
Plan performance |
The plan designer must weigh file-based versus database matching approaches when considering plan requirements. |
Time window and frequency of execution |
Plan performance |
The time taken for a matching plan to complete execution depends on its scale. Timing requirements must be understood up-front. |
Match identification |
Quality of matches |
The plan designer must weigh deterministic versus probabilistic approaches. |
Group Size
Grouping breaks large datasets down into smaller ones to reduce the number of record-to-record comparisons performed in the plan, which directly impacts the speed of plan execution. When matching on grouped data, a matching plan compares the records within each group with one another. When grouping is implemented properly, plan execution speed is increased significantly, with no meaningful effect on match quality.
The most important determinant of plan execution speed is the size of the groups to be processed — that is, the number of data records in each group.
For example, consider a dataset of 1,000,000 records, for which a grouping strategy generates 10,000 groups. If 9,999 of these groups have an average of 50 records each, the remaining group will contain more than 500,000 records; based on this one large group, the matching plan would require 87 days to complete, processing 1,000,000 comparisons a minute! In comparison, the remaining 9,999 groups could be matched in about 12 minutes if the group sizes were evenly distributed.
Group size can also have an impact on the quality of the matches returned in the matching plan. Large groups perform more record comparisons, so more likely matches are potentially identified. The reverse is true for small groups. As groups get smaller, fewer comparisons are possible, and the potential for missing good matches is increased. The goal of grouping is to optimize performance while minimizing the possibility that valid matches will be overlooked because like records are assigned to different groups. Therefore, groups must be defined intelligently through the use of group keys.
Group Keys
Group keys determine which records are assigned to which groups. Group key selection, therefore, has a significant affect on the success of matching operations.
Grouping splits data into logical chunks and thereby reduces the total number of comparisons performed by the plan. The selection of group keys, based on key data fields, is critical to ensuring that relevant records are compared against one another.
When selecting a group key, two main criteria apply:
- Candidate group keys should represent a logical separation of the data into distinct units where there is a low probability that matches exist between records in different units. This can be determined by profiling the data and uncovering the structure and quality of the content prior to grouping.
- Candidate group keys should also have high scores in three keys areas of data quality: completeness, conformity, and accuracy. Problems in these data areas can be improved by standardizing the data prior to grouping.
For example, geography is a logical separation criterion when comparing name and address data. A record for a person living in Canada is unlikely to match someone living in Ireland. Thus, the country-identifier field can provide a useful group key. However, if you are working with national data (e.g. Swiss data), duplicate data may exist for an individual living in Geneva, who may also be recorded as living in Genf or Geneve. If the group key in this case is based on city name, records for Geneva, Genf, and Geneve will be written to different groups and never compared — unless variant city names are standardized.
Size of Dataset
In matching, the size of the dataset typically does not have as significant an impact on plan performance as the definition of the groups within the plan. However, in general terms, the larger the dataset, the more time required to produce a matching plan — both in terms of the preparation of the data and the plan execution.
IDQ Components
All IDQ components serve specific purposes, and very little functionality is duplicated across the components. However, there are performance implications for certain component types, combinations of components, and the quantity of components used in the plan.
Several tests have been conducted on IDQ (version 2.11) to test source/sink combinations and various operational components. In tests comparing file-based matching against database matching, file-based matching outperformed database matching in UNIX and Windows environments for plans containing up to 100,000 groups. Also, matching plans that wrote output to a CSV Sink outperformed plans with a DB Sink or Match Key Sink. Plans with a Mixed Field Matcher component performed more slowly than plans without a Mixed Field Matcher.
Raw performance should not be the only consideration when selecting the components to use in a matching plan. Different components serve different needs and may offer advantages in a given scenario.
Time Window
IDQ can perform millions or billions of comparison operations in a single matching plan. The time available for the completion of a matching plan can have a significant impact on the perception that the plan is running correctly.
Knowing the time window for plan completion helps to determine the hardware configuration choices, grouping strategy, and the IDQ components to employ.
Frequency of Execution
The frequency with which plans are executed is linked to the time window available. Matching plans may need to be tuned to fit within the cycle in which they are run. The more frequently a matching plan is run, the more the execution time will have to be considered.
Match Identification
The method used by IDQ to identify good matches has a significant effect on the success of the plan. Two key methods for assessing matches are:
- deterministic matching
- probabilistic matching
Deterministic matching applies a series of checks to determine if a match can be found between two records. IDQ’s fuzzy matching algorithms can be combined with this method. For example, a deterministic check may first check if the last name comparison score was greater than 85 percent. If this is true, it next checks the address. If an 80 percent match is found, it then checks the first name. If a 90 percent match is found on the first name, then the entire record is considered successfully matched.
The advantages of deterministic matching are: (1) it follows a logical path that can be easily communicated to others, and (2) it is similar to the methods employed when manually checking for matches. The disadvantages to this method are its rigidity and its requirement that each dependency be true. This can result in matches being missed, or can require several different rule checks to cover all likely combinations.
Probabilistic matching takes the match scores from fuzzy matching components and assigns weights to them in order to calculate a weighted average that indicates the degree of similarity between two pieces of information.
The advantage of probabilistic matching is that it is less rigid than deterministic matching. There are no dependencies on certain data elements matching in order for a full match to be found. Weights assigned to individual components can place emphasis on different fields or areas in a record. However, even if a heavily-weighted score falls below a defined threshold, match scores from less heavily-weighted components may still produce a match.
The disadvantages of this method are a higher degree of required tweaking on the user’s part to get the right balance of weights in order to optimize successful matches. This can be difficult for users to understand and communicate to one another.
Also, the cut-off mark for good matches versus bad matches can be difficult to assess. For example, a matching plan with 95 to 100 percent success may have found all good matches, but matching plan success between 90 and 94 percent may map to only 85 percent genuine matches. Matches between 85 and 89 percent may correspond to only 65 percent genuine matches, and so on. The following table illustrates this principle.
Close analysis of the match results is required because of the relationship between match quality and match thresholds scores assigned since there may not be a one-to-one mapping between the plan’s weighted score and the number of records that can be considered genuine matches.
Best Practice Operations
The following section outlines best practices for matching with IDQ.
Capturing Client Requirements
Capturing client requirements is key to understanding how successful and relevant your matching plans are likely to be. As a best practice, be sure to answer the following questions, as a minimum, before designing and implementing a matching plan:
- How large is the dataset to be matched?
- How often will the matching plans be executed?
- When will the match process need to be completed?
- Are there any other dependent processes?
- What are the rules for determining a match?
- What process is required to sign-off on the quality of match results?
- What processes exist for merging records?
Test Results
Performance tests demonstrate the following:
- IDQ has near-linear scalability in a multi-processor environment.
- Scalability in standard installations, as achieved in the allocation of matching plans to multiple processors, will eventually level off.
Performance is the key to success in high-volume matching solutions. IDQ’s architecture supports massive scalability by allowing large jobs to be subdivided and executed across several processors. This scalability greatly enhances IDQ’s ability to meet the service levels required by users without sacrificing quality or requiring an overly complex solution.
If IDQ is integrated with PowerCenter, matching scalability can be achieved using PowerCenter's partitioning capabilities.
Managing Group Sizes
As stated earlier, group sizes have a significant affect on the speed of matching plan execution. Also, the quantity of small groups should be minimized to ensure that the greatest number of comparisons are captured. Keep the following parameters in mind when designing a grouping plan.
Condition |
Best practice |
Exceptions |
Maximum group size |
5,000 records |
Large datasets over 2M records with uniform data. Minimize the number of groups containing more than 5,000 records. |
Minimum number of single-record groups |
1,000 groups per one million record dataset. |
|
Optimum number of comparisons |
500,000,000 comparisons per 1 million records |
+/- 20 percent |
In cases where the datasets are large, multiple group keys may be required to segment the data to ensure that best practice guidelines are followed. Informatica Corporation can provide sample grouping plans that automate these requirements as far as is practicable.
Group Key Identification
Identifying appropriate group keys is essential to the success of a matching plan. Ideally, any dataset that is about to be matched has been profiled and standardized to identify candidate keys.
Group keys act as a “first pass” or high-level summary of the shape of the dataset(s). Remember that only data records within a given group are compared with one another. Therefore, it is vital to select group keys that have high data quality scores for completeness, conformity, consistency, and accuracy.
Group key selection depends on the type of data in the dataset, for example whether it contains name and address data or other data types such as product codes.
Hardware Specifications
Matching is a resource-intensive operation, especially in terms of processor capability. Three key variables determine the effect of hardware on a matching plan: processor speed, disk performance, and memory.
The majority of the activity required in matching is tied to the processor. Therefore, the speed of the processor has a significant affect on how fast a matching plan completes. Although the average computational speed for IDQ is one million comparisons per minute, the speed can range from as low as 250,000 comparisons to 6.5 million comparisons per minute, depending on the hardware specification, background processes running, and components used. As a best practice, higher-specification processors (e.g., 1.5 GHz minimum) should be used for high-volume matching plans.
Hard disk capacity and available memory can also determine how fast a plan completes. The hard disk reads and writes data required by IDQ sources and sinks. The speed of the disk and the level of defragmentation affect how quickly data can be read from, and written to, the hard disk. Information that cannot be stored in memory during plan execution must be temporarily written to the hard disk. This increases the time required to retrieve information that otherwise could be stored in memory, and also increases the load on the hard disk. A RAID drive may be appropriate for datasets of 3 to 4 million records and a minimum of 512MB of memory should be available.
The following table is a rough guide for hardware estimates based on IDQ Runtime on Windows platforms. Specifications for UNIX-based systems vary.
Match volumes |
Suggested hardware specification |
< 1,500,000 records |
1.5 GHz computer, 512MB RAM |
1,500,000 to 3 million records |
Multi processor server, 1GB RAM |
> 3 million records |
Multi-processor server, 2GB RAM, RAID 5 hard disk |
Single Processor vs. Multi-Processor
With IDQ Runtime, it is possible to run multiple processes in parallel. Matching plans, whether they are file-based or database-based, can be split into multiple plans to take advantage of multiple processors on a server. Be aware however, that this requires additional effort to create the groups and consolidate the match output. Also, matching plans split across four processors do not run four times faster than a single-processor matching plan. As a result, multi-processor matching may not significantly improve performance in every case.
Using IDQ with PowerCenter and taking advantage of PowerCenter's partitioning capabilities may also improve throughput. This approach has the advantage that splitting plans into multiple independent plans is not typically required.
The following table can help in estimating the execution time between a single and multi-processor match plan.
Plan Type |
Single Processor |
Multiprocessor |
Standardardization/ grouping |
Depends on operations and size of data set. (Time equals Y) |
Single processor time plus 20 percent. (Time equals Y * 1.20) |
Matching |
Est 1 million comparisons a minute. (Time equals X) |
Time for single processor matching divided by no or processors (NP) multiplied by 25 percent. (Time equals [(X / NP) * 1.25]) |
For example, if a single processor plan takes one hour to group and standardize the data and eight hours to match, a four-processor match plan should require approximately one hour and 20 minute to group and standardize and two and one half hours to match. The time difference between a single- and multi-processor plan in this case would be more than five hours (i.e., nine hours for the single processor plan versus three hours and 50 minutes for the quad-processor plan).
Deterministic vs. Probabilistic Comparisons
No best-practice research has yet been completed on which type of comparison is most effective at determining a match. Each method has strengths and weaknesses. A 2006 article by Forrester Research stated a preference for deterministic comparisons since they remove the burden of identifying a universal match threshold from the user.
Bear in mind that IDQ supports deterministic matching operations only. However, IDQ’s Weight Based Analyzer component lets plan designers calculate weighted match scores for matched fields.
Database vs. File-Based Matching
File-based matching and database matching perform essentially the same operations. The major differences between the two methods revolve around how data is stored and how the outputs can be manipulated after matching is complete. With regards to selecting one method or the other, there are no best practice recommendations since this is largely defined by requirements.
The following table outlines the strengths and weakness of each method:
File-Based Method |
Database Method |
|
Ease of implementation |
Easy to implement |
Requires SQL knowledge |
Performance |
Fastest method |
Slower than file-based method |
Space utilization |
Requires more hard-disk space |
Lower hard-disk space requirement |
Operating system restrictions |
Possible limit to number of groups that can be created |
None |
Ability to control/ manipulate output |
Low |
High |
High-Volume Data Matching Techniques
This section discusses the challenges facing IDQ matching plan designers in optimizing their plans for speed of execution and quality of results. It highlights the key factors affecting matching performance and discusses the results of IDQ performance testing in single and multi-processor environments.
Checking for duplicate records where no clear connection exists among data elements is a resource-intensive activity. In order to detect matching information, a record must be compared against every other record in a dataset. For a single data source, the quantity of comparisons required to check an entire dataset increases geometrically as the volume of data increases. A similar situation arises when matching between two datasets, where the number of comparisons required is a multiple of the volumes of data in each dataset.
When the volume of data increases into the tens of millions, the number of comparisons required to identify matches — and consequently, the amount of time required to check for matches — reaches impractical levels.
Approaches to High-Volume Matching
Two key factors control the time it takes to match a dataset:
- The number of comparisons required to check the data.
- The number of comparisons that can be performed per minute.
The first factor can be controlled in IDQ through grouping, which involves logically segmenting the dataset into distinct elements, or groups, so that there is a high probability that records within a group are not duplicates of records outside of the group. Grouping data greatly reduces the total number of required comparisons without affecting match accuracy.
IDQ affects the number of comparisons per minute in two ways:
- Its matching components maximize the comparison activities assigned to the computer processor. This reduces the amount of disk I/O communication in the system and increases the number of comparisons per minute. Therefore, hardware with higher processor speeds has higher match throughputs.
- IDQ architecture also allows matching tasks to be broken into smaller tasks and shared across multiple processors. The use of multiple processors to handle matching operations greatly enhances IDQ scalability with regard to high-volume matching problems.
The following section outlines how a multi-processor matching solution can be implemented and illustrates the results obtained in Informatica Corporation testing.
Multi-Processor Matching: Solution Overview
IDQ does not automatically distribute its load across multiple processors. To scale a matching plan to take advantage of a multi-processor environment, the plan designer must develop multiple plans for execution in parallel.
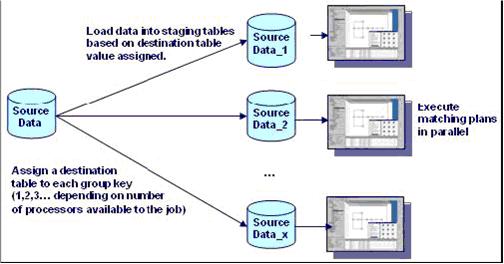
To develop this solution, the plan designer first groups the data to prevent the plan from running low-probability comparisons. Groups are then subdivided into one or more subgroups (the number of subgroups depends on the plan being run and the number of processors in use). Each subgroup is assigned to a discrete matching plan, and the plans are executed in parallel.
The following diagram outlines how multi-processor matching can be implemented in a database model. Source data is first grouped and then subgrouped according to the number of processors available to the job. Each subgroup of data is loaded into a separate staging area, and the discrete match plans are run in parallel against each table. Results from each plan are consolidated to generate a single match result for the original source data.
Informatica Corporation Match Plan Tests
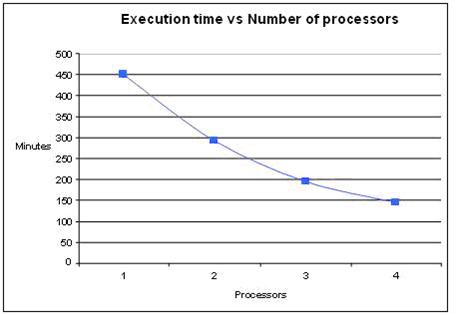
Informatica Corporation performed match plan tests on a 2GHz Intel Xeon dual-processor server running Windows 2003 (Server edition). Two gigabytes of RAM were available. The hyper-threading ability of the Xeon processors effectively provided four CPUs on which to run the tests.
Several tests were performed using file-based and database-based matching methods and single and multiple processor methods. The tests were performed on one million rows of data. Grouping of the data limited the total number of comparisons to approximately 500,000,000.
Test results using file-based and database-based methods showed a near linear scalability as the number of available processors increased. As the number of processors increased, so too did the demand on disk I/O resources. As the processor capacity began to scale upward, disk I/O in this configuration eventually limited the benefits of adding additional processor capacity. This is demonstrated in the graph below.
Execution times for multiple processors were based on the longest execution time of the jobs run in parallel. Therefore, having an even distribution of records across all processors was important to maintaining scalability. When the data was not evenly distributed, some match plans ran longer than others, and the benefits of scaling over multiple processors was not as evident.