-
Manage your Success Plans and Engagements, gain key insights into your implementation journey, and collaborate with your CSMsSuccessAccelerate your Purchase to Value by engaging with Informatica for Customer SuccessAll your Engagements at one place
-
A collaborative platform to connect and grow with like-minded Informaticans across the globeCommunitiesConnect and collaborate with Informatica experts and championsHave a question? Start a Discussion and get immediate answers you are looking forCustomer-organized groups that meet online and in-person. Join today to network, share ideas, and get tips on how to get the most out of Informatica
-
Troubleshooting documents, product guides, how to videos, best practices, and moreKnowledge CenterOne-stop self-service portal for solutions, FAQs, Whitepapers, How Tos, Videos, and moreVideo channel for step-by-step instructions to use our products, best practices, troubleshooting tips, and much moreInformation library of the latest product documents
-
Rich resources to help you leverage full capabilities of our productsLearnRole-based training programs for the best ROIGet certified on Informatica products. Free, Foundation, or ProfessionalFree and unlimited modules based on your expertise level and journeySelf-guided, intuitive experience platform for outcome-focused product capabilities and use cases
-
Library of content to help you leverage the best of Informatica productsResourcesMost popular webinars on product architecture, best practices, and moreProduct Availability Matrix statements of Informatica productsMonthly support newsletterInformatica Support Guide and Statements, Quick Start Guides, and Cloud Product Description ScheduleEnd of Life statements of Informatica productsMonitor the status of your Informatica services across regions
- Velocity
- Strategy
-
Solutions
- Stages
-
More
-
Manage your Success Plans and Engagements, gain key insights into your implementation journey, and collaborate with your CSMsManage your Success Plans and Engagements, gain key insights into your implementation journey, and collaborate with your CSMsAccelerate your Purchase to Value by engaging with Informatica for Customer SuccessAll your Engagements at one place
-
A collaborative platform to connect and grow with like-minded Informaticans across the globeA collaborative platform to connect and grow with like-minded Informaticans across the globeConnect and collaborate with Informatica experts and championsHave a question? Start a Discussion and get immediate answers you are looking forCustomer-organized groups that meet online and in-person. Join today to network, share ideas, and get tips on how to get the most out of Informatica
-
Troubleshooting documents, product guides, how to videos, best practices, and moreTroubleshooting documents, product guides, how to videos, best practices, and moreOne-stop self-service portal for solutions, FAQs, Whitepapers, How Tos, Videos, and moreVideo channel for step-by-step instructions to use our products, best practices, troubleshooting tips, and much moreInformation library of the latest product documents
-
Rich resources to help you leverage full capabilities of our productsRich resources to help you leverage full capabilities of our productsRole-based training programs for the best ROIGet certified on Informatica products. Free, Foundation, or ProfessionalFree and unlimited modules based on your expertise level and journeySelf-guided, intuitive experience platform for outcome-focused product capabilities and use cases
-
Library of content to help you leverage the best of Informatica productsLibrary of content to help you leverage the best of Informatica productsMost popular webinars on product architecture, best practices, and moreProduct Availability Matrix statements of Informatica productsMonthly support newsletterInformatica Support Guide and Statements, Quick Start Guides, and Cloud Product Description ScheduleEnd of Life statements of Informatica productsMonitor the status of your Informatica services across regions
-
KPI Driven Data Quality
Data Governance & Privacy
Challenge
Data quality rules need to be derived from Key Performance Indicators (KPIs) in order to align Data Quality solution design with the goals of the business. The intent of this document is to provide a means for deriving key Data Quality Rules from KPIs and implementing them with a high degree of reusability and the lowest degree of complexity.
Description
Key Performance Indicators measure a definition of what makes a business successful. Managing these metrics for any project leads to a higher level of success, decreased costs and/or increased revenue. It is important to think beyond direct costs when defining KPIs and look to measure other aspects of the business. Simply put, most projects should have KPIs that include measures of data quality. Appropriately defined KPIs allow a business to easily quantify the relative costs related to bad data and enables the business to recognize more value from their data quality solution.
When Data Quality solutions are built around these KPIs, Business Analyst and Stewards will see a number of benefits. First, they are better able to translate esoteric data quality problems into quantifiable and often tangible costs to the business. This makes reporting to management much easier as the relevance and magnitude of the metrics are in easily understood business terms. The benefits extend to the development of the solution itself; KPI based rules allow for a greater level of standardization and reuse of Data Quality components.
Overview
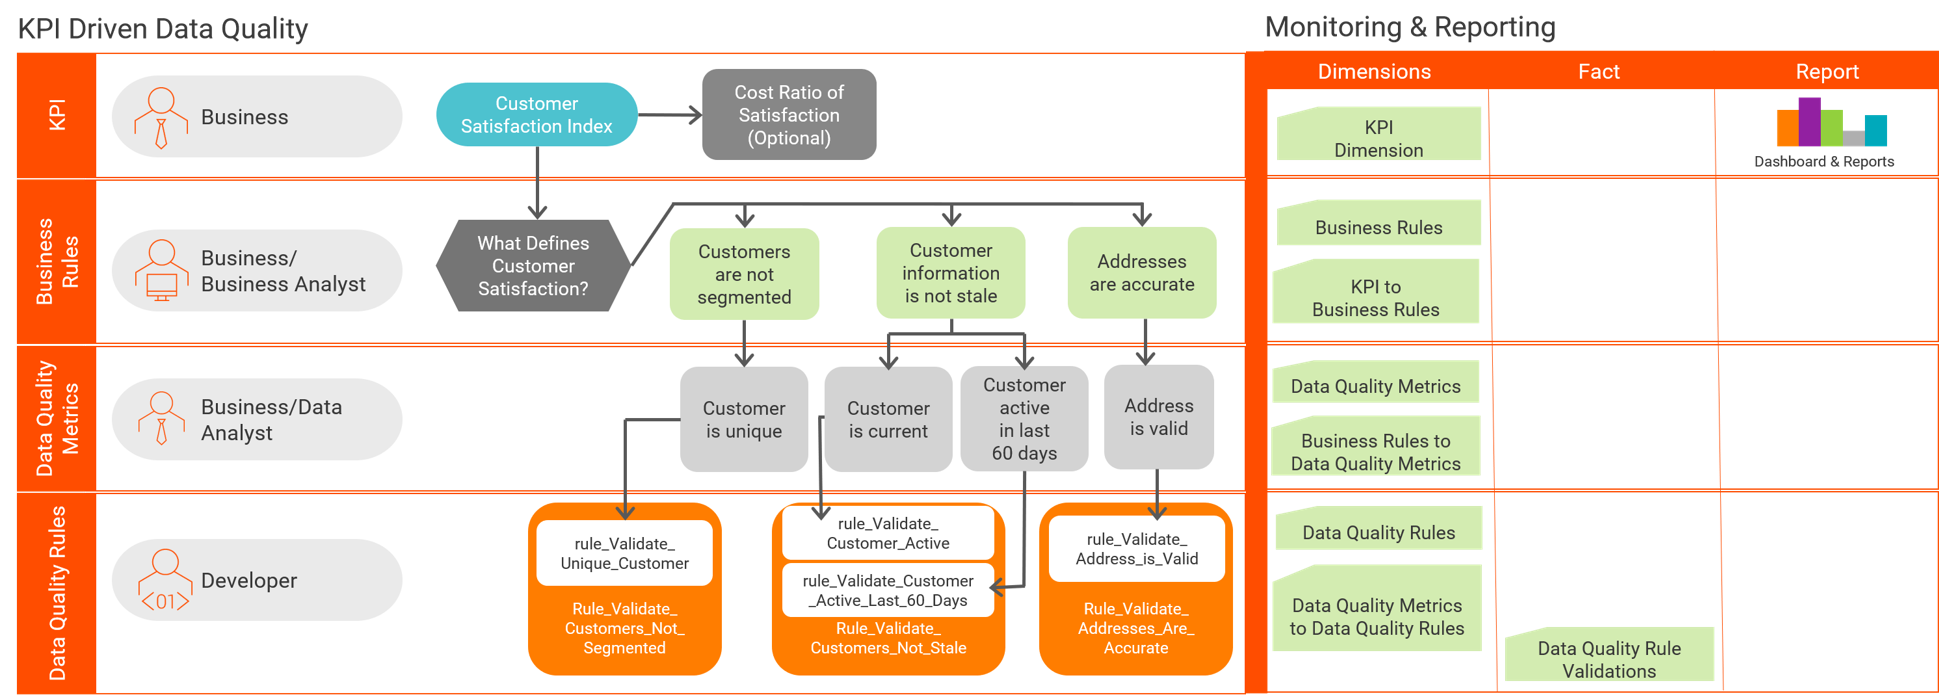
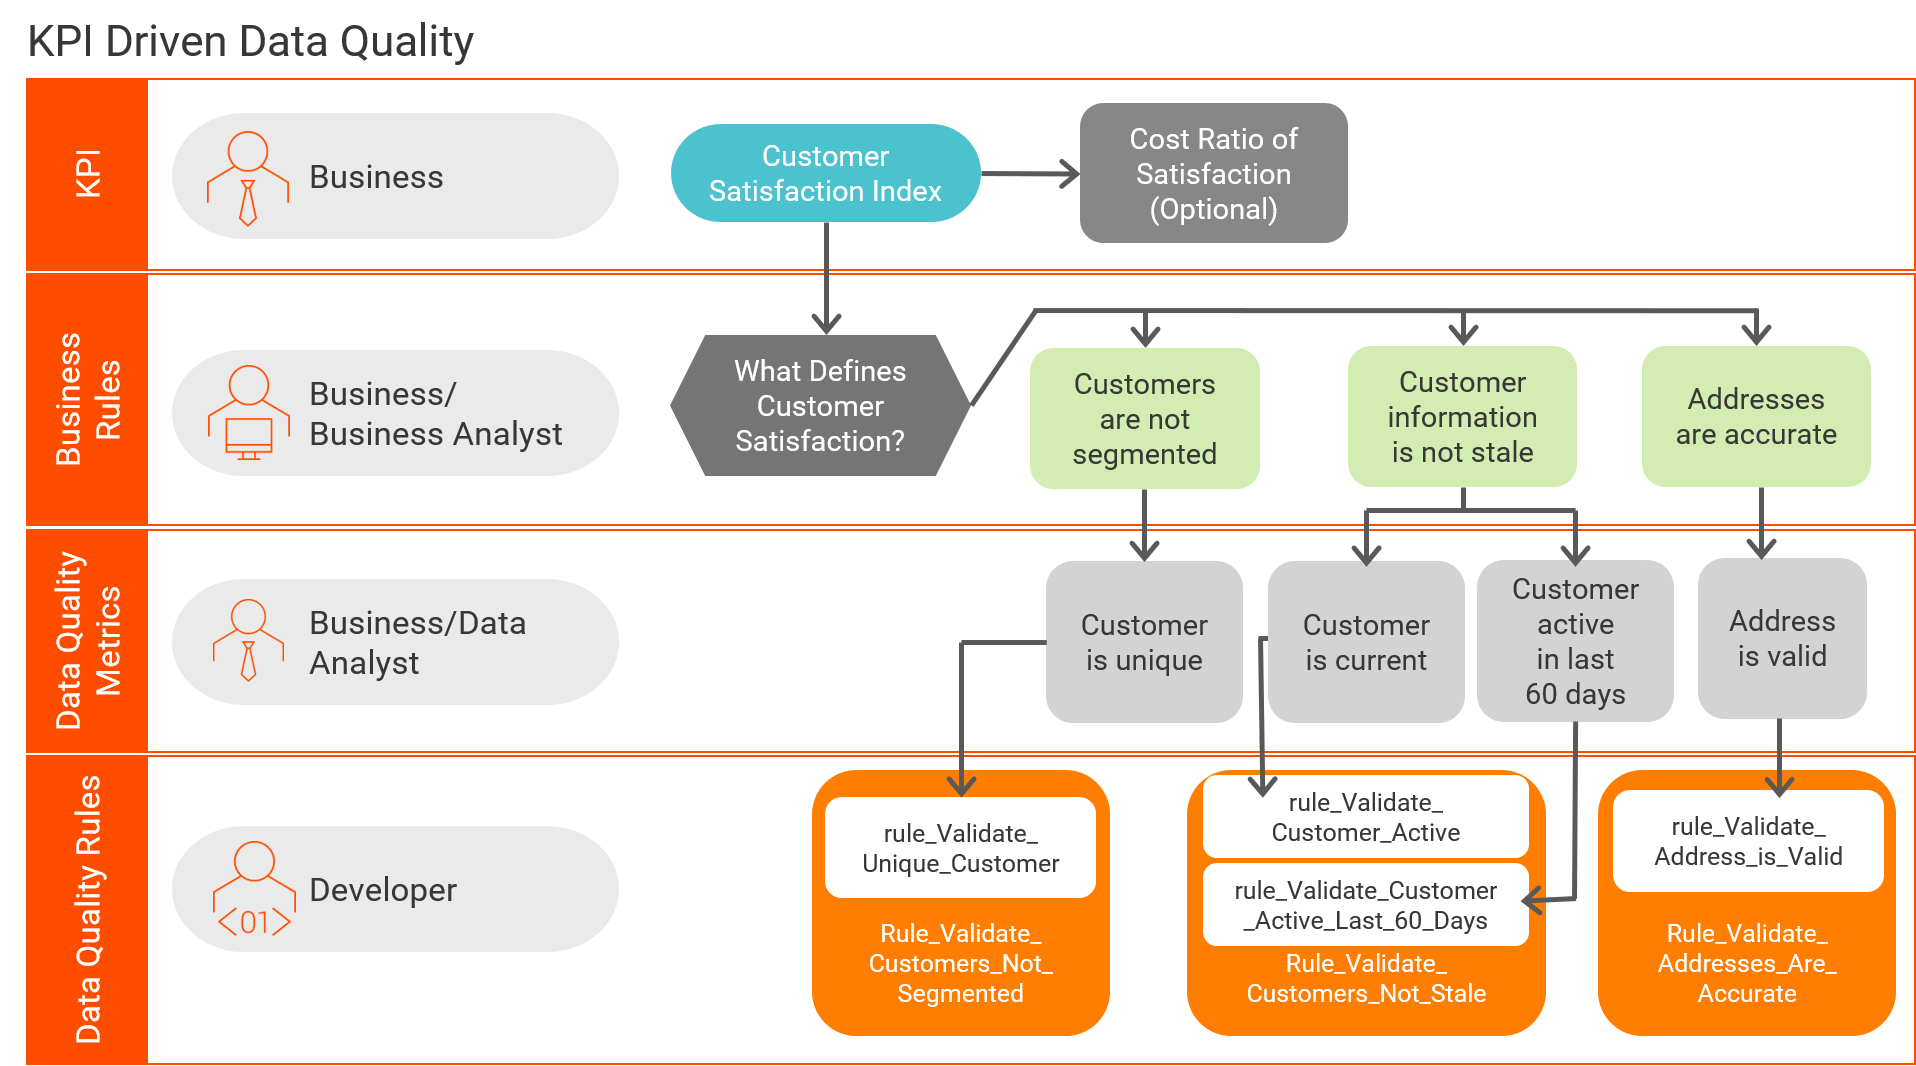
A number of components are required to build a Data Quality Rule from a KPI. It starts with the KPI itself, the business rules that support the KPI, the data quality metrics that define the business rule (at the technical level), and finally the Data Quality Rules that quantify the data quality metrics. The Data Quality Rules may include sub-rules to increase the modularity and reusability of the developed code.
Below is the high-level rollout of a KPI-derived Data Quality Rule:
Key Performance Indicator ==> Determine Business Rules ==> Define Data Quality Metric(s) ==> Design & Build Data Quality Rule(s)
Key Performance Indicators
Below are some example Key Performance Indicators that will be used as part of the implementation example:
Customer Satisfaction Index - This KPI describes the overall satisfaction an Organization’s customers have with them. This KPI ultimately reflects the size of the pool of new and repeat customers. A happy customer is a repeat customer and a good reference to others.
Inventory to Sales Ratio – This KPI reflects how well the Organization manages inventory with current sales volume. Sales do not have much value if there is no inventory.
Invoice to Payment Lag – This KPI reveals how quickly invoices are paid and profits can be realized. Money is not appreciable until it is in the bank.

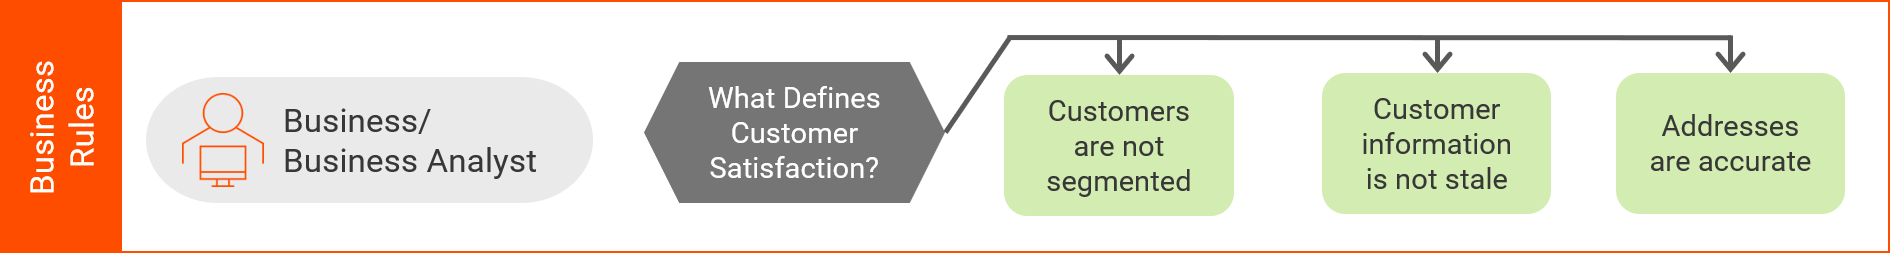
Business Rules
With KPIs identified, the business can correlate these high-level marks of success with the components that support them. Some of these will be shared across multiple KPIs and as such, reusable. These are italicized.
Here are some examples of business rules that would tie into the above KPIs:
Addresses are accurate – the accuracy of addresses determine how well an organization is capable of delivering to customers on time, maintaining an accurate inventory per location or sending invoices and receiving payments. These correlate to Customer Satisfaction, lower incidence of inventory duplication and decreased time in receiving payments, respectively.
Customers are not segmented – this means that customers are well understood and not excessively duplicated within an organization. This has a direct correlation to the quality of customer interactions.
Customer information is not stale – whether a customer is a current customer or has had recent activity determines how confident an organization is with the information they have on hand (appropriate last names, addresses, etc…). The greater the confidence, the more precise a customer can be interacted with and marketed to, increasing customer satisfaction.
Items are shippable - items must be in a shippable state in order to fulfil orders and thus reflects heavily on how many sales an organization can accommodate.
Invoices are paid on time – unpaid invoices or delayed invoice payments reflect negatively on the actual cash flow within an organization.
With the business rules identified and understood, they can be associated with the KPIs:
Customer Satisfaction Index
- Customers are not segmented
- Customers information is not stale
- Addresses are accurate
Inventory to Sales Ratio
- Items are shippable
- Addresses are accurate
Invoice to Payment Lag
- Customers information is not stale
- Addresses are accurate
- Invoices are paid on time
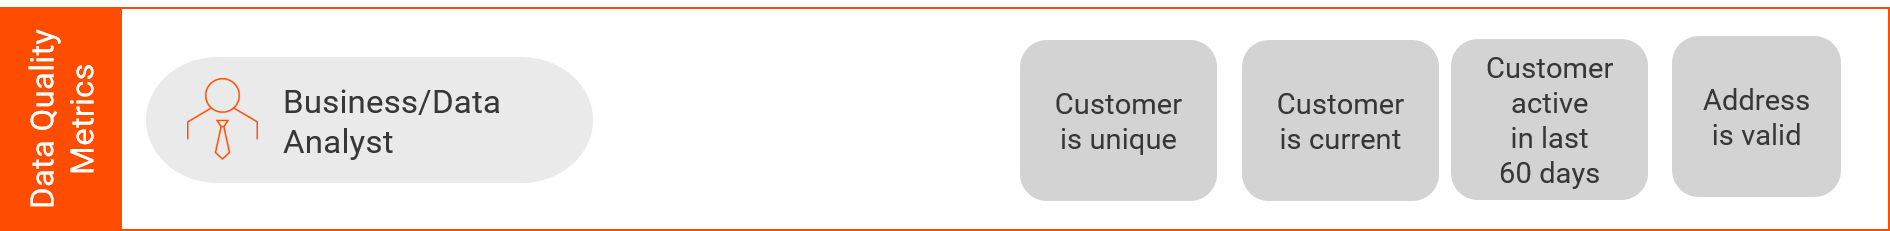
Data Quality Metrics
After the business rules are defined, begin the next step and convert these high-level definitions into specific measures for evaluation.
Addresses are accurate – Ensuring addresses are accurate requires running them through address standardization and validation by using a tool such as Address Doctor. The DQ metrics would therefore be that the address has been standardized to postal service specifications and then pass validation (i.e. Match Code of C or V).
The DQ metric(s): “Address is Valid”
Customers are not segmented – Measuring the degree of customer segmentation requires a rule that will determine how many duplicates exist using Identity or algorithm matching.
The DQ metric(s): “Customer is unique”
Customer information is not stale – Evaluating whether customer information is stale requires various tests on the customer record itself.
The DQ metric(s): “Customer is Current” and “Customer has had activity in last 60 days”
Items are shippable – The number of items that are shippable can be determined by measuring quantity on hand, whether they have been priced and whether the inventory location is operational.
The DQ metric(s): “Inventory on Hand”, “Inventory Priced”, “Warehouse Operational”
Invoices are paid on time – Invoice payments can be measured within accounts receivable.
The DQ metric(s): “Invoices paid within 30 days of due date” and “Invoices paid in full”
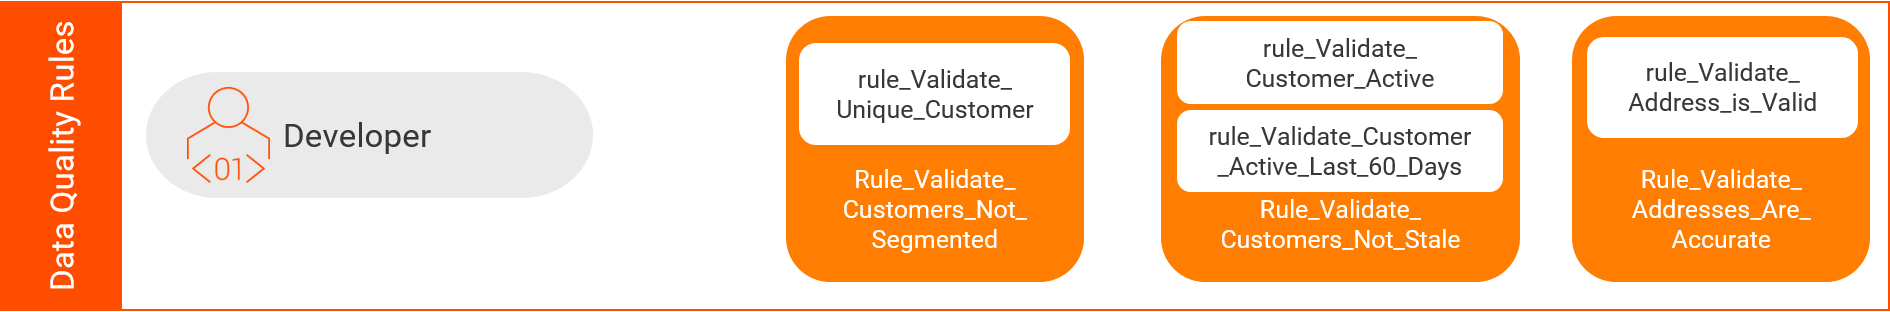
Data Quality Rules
With the Data Quality Metrics defined, we can tie these into specific rules for executing the validations.
Addresses are accurate
Address is Valid
rule_Validate_Address
- Address Doctor Standardization
- Valid derived from Match Code C or V; else Invalid
Customers are not segmented
Customer is unique
mplt_Validate_Unique_Customer
- Match Option 1 (Traditional):
- Uses address from rule_Validate_Address
- Cleanses Name components with Name Accelerators
- Cleanses Phone components with Phone Accelerators
- Matches using Data Quality Algorithms with Name, Phone and Address
- Match Option 2 (Identity Match Option):
- Uses Identity Match Individual Population
- Valid derived from cluster size of 1; else Invalid
Note: Active objects, such as matching cannot be placed in a rule and executed via a Profile. This is not an issue for mapping-based reporting solutions. However, if a Profile/Scorecard-based solution is desired, a mapping could be used to stage the match data. A rule (rule_Validate_Unique_Customer) can be built on the staged data for use in profiling.
Note: Active objects are defined by having n input records and n+1 or n-1 output records.
Customer information is not stale
Customer is Current
rule_Validate_Customer_Active
- Valid when Active Indicator is set; else Invalid
Customer has had activity in last 60 days
rule_Validate_Customer_Active_Last_60Days
- Valid when either last purchase date, last online log in date or last customer support date was within sixty days of today; else Invalid
Items are shippable
Inventory on Hand
rule_Validate_Inventory_on_Hand
- Valid when quantity on hand is greater than zero; else Invalid
Inventory Priced
rule_Validate_Inventory_Priced
- Valid when Unit Price is not null, blank or zero; else Invalid
Warehouse Operational
rule_Validate_Warehouse_Operational
- Valid when Warehouse Status Flag is Active; else Invalid
Invoices are paid on time
Invoices paid within 30 days of due date
rule_Validate_Invoices_Paid_on_Time
- Valid when Date Paid is within 30 days past Date Due and Amount Paid is greater than or equal to Amount Due; else Invalid
Invoices paid in full
rule_Invoices_Paid_on_Time
- Valid when Amount Paid is greater than or equal to Amount Due; else Invalid
Monitoring and Reporting
With the physical Data Quality Rules built and the association all the way up to the KPIs defined, the KPIs can now be reported on and monitored. There are several ways to go about this based on an organization’s requirements.
Below are some examples with their advantages and disadvantages; however, these options should not be considered the only means to facilitate implementation.
Profiles and Scorecards
The first option is very basic. The individual rules can be grouped and utilized by a Logical Data Object (LDO). LDOs running against Production or a copy of Production data can then be profiled or added to scorecards to track the status of each KPI and/or Data Quality rule.
Advantages:
- Easy to setup and rollout
Disadvantages:
- Not very well suited to scale up to a large number of KPIs
- Requires periodic execution of Profiles and Scorecards
- Trending may be difficult to track
Reporting Schema Loads and External Reports
The second option requires more effort, but provides richer results. Mappings consisting of the individual rules could be developed and executed against the target data set in order to populate a reporting schema. The reporting schema could then be referenced by any BI tool, including Informatica Reporting and Dashboard Service. With these approaches, any number of specific reports and dashboards could be developed. Alternatively, the pre-built Data Quality Dashboards and Reporting template could either be used out of the box or adapted for specific uses.
Advantages:
- Highly scalable
- High visibility across the organization
- Easier to maintain trends
- Customized to specific needs
Disadvantages:
- Requires substantial effort in building out reporting schema and load mappings