Challenge
Knowing that all data for the current load cycle has loaded correctly is essential for effective data warehouse management. However, the need for load validation varies depending on the extent of error checking, data validation, and data cleansing functionalities inherent in your mappings. For large data integration projects with thousands of mappings, the task of reporting load statuses becomes overwhelming without a well-planned load validation process.
Description
Methods for validating the load process range from simple to complex. Use the following steps to plan a load validation process:
- Determine what information you need for load validation (e.g., work flow names, session names, session start times, session completion times, successful rows and failed rows).
- Determine the source of the information. All of this information is stored as metadata in the PowerCenter repository, but you must have a means of extracting it.
- Determine how you want the information presented to you. Should the information be delivered in a report? Do you want it emailed to you? Do you want it available in a relational table so that history is easily preserved? Do you want it stored as a flat file?
Weigh all of these factors to find the correct solution for your project.
Below are descriptions of five possible load validation solutions, ranging from fairly simple to increasingly complex:
1. Post-session Emails on Success or Failure
One practical application of the post-session email functionality is the situation in which a key business user waits for completion of a session to run a report. Email is configured to notify the user when the session was successful so that the report can be run. Another practical application is the situation in which a production support analyst needs to be notified immediately of any failures. Configure the session to send an email to the analyst upon failure. For round-the-clock support, a pager number that has the ability to receive email can be used in place of an email address.
Post-session email is configured in the session, under the General tab and ‘Session Commands’.
A number of variables are available to simplify the text of the email:
- %s Session name
- %e Session status
- %b Session start time
- %c Session completion time
- %i Session elapsed time
- %l Total records loaded
- %r Total records rejected
- %t Target table details
- %m Name of the mapping used in the session
- %n Name of the folder containing the session
- %d Name of the repository containing the session
- %g Attach the session log to the message
- %a <file path> Attach a file to the message
2. Other Workflow Manager Features
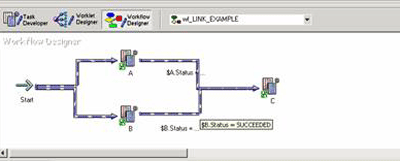
In addition to post session email messages, there are other features available in the Workflow Manager to help validate loads. Control, Decision, Event, and Timer tasks are some of the features that can be used to place multiple controls on the behavior of loads. Another solution is to place conditions within links. Links are used to connect tasks within a workflow or worklet. Use the pre-defined or user-defined variables in the link conditions. In the example below, upon the ‘Successful’ completion of both sessions A and B, the PowerCenter Server executes session C.

3. PowerCenter Reports (PCR)
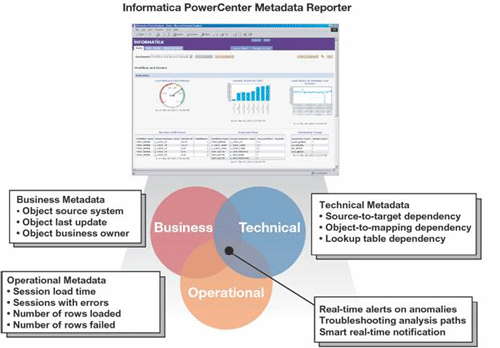
The PowerCenter Reports (PCR) is a web-based business intelligence (BI) tool that is included with every PowerCenter license to provide visibility into metadata stored in the PowerCenter repository in a manner that is easy to comprehend and distribute. The PCR includes more than 130 pre-packaged metadata reports and dashboards delivered through Data Analyzer, Informatica’s BI offering. These pre-packaged reports enable PowerCenter customers to extract extensive business and technical metadata through easy-to-read reports including:
- Load statistics and operational metadata that enable load validation.
- Table dependencies and impact analysis that enable change management.
- PowerCenter object statistics to aid in development assistance.
- Historical load statistics that enable planning for growth.

In addition to the 130 pre-packaged reports and dashboards that come standard with PCR, you can develop additional custom reports and dashboards that are based upon the PCR limited-use license that allows you to source reports from the PowerCenter repository. Examples of custom components that can be created include:
- Repository-wide reports and/or dashboards with indicators of daily load success/failure.
- Customized project-based dashboard with visual indicators of daily load success/failure.
- Detailed daily load statistics report for each project that can be exported to Microsoft Excel or PDF.
- Error handling reports that deliver error messages and source data for row level errors that may have occurred during a load.
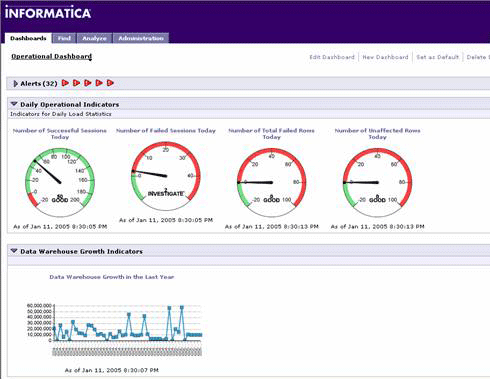
Below is an example of a custom dashboard that gives instant insight into the load validation across an entire repository through four custom indicators.

4. Query Informatica Metadata Exchange (MX) Views
Informatica Metadata Exchange (MX) provides a set of relational views that allow easy SQL access to the PowerCenter repository. The Repository Manager generates these views when you create or upgrade a repository. Almost any query can be put together to retrieve metadata related to the load execution from the repository. The MX view, REP_SESS_LOG, is a great place to start. This view is likely to contain all the information you need. The following sample query shows how to extract folder name, session name, session end time, successful rows, and session duration:
select subject_area, session_name, session_timestamp, successful_rows,
(session_timestamp - actual_start) * 24 * 60 * 60 from rep_sess_log a where
session_timestamp = (select max(session_timestamp) from rep_sess_log
where session_name =a.session_name) order by subject_area, session_name
The sample output would look like this:

TIP >>>
Informatica strongly advises against querying directly from the repository tables. Because future versions of PowerCenter are likely to alter the underlying repository tables, PowerCenter supports queries from the unaltered MX views, not the repository tables.
5. Mapping Approach
A more complex approach, and the most customizable, is to create a PowerCenter mapping to populate a table or a flat file with desired information. You can do this by sourcing the MX view REP_SESS_LOG and then performing lookups to other repository tables or views for additional information.
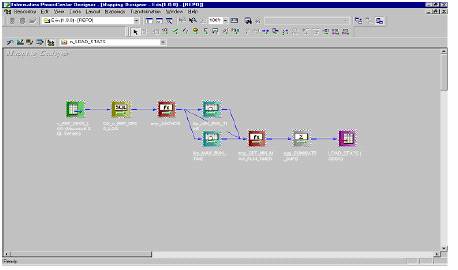
The following graphic illustrates a sample mapping:

This mapping selects data from REP_SESS_LOG and performs lookups to retrieve the absolute minimum and maximum run times for that particular session. This enables you to compare the current execution time with the minimum and maximum durations.
Note: Unless you have acquired additional licensing, a customized metadata data mart cannot be a source for a PCR report. However, you can use a business intelligence tool of your choice instead.
